Problem
Collect tweets (not retweets/replies) of 5 verified Indian police accounts, and do Data Analysis, Data Visualization and Sentiment Analysis and show the results and graphs in a web app.
Solution
Web App = Flask + Heroku + MongoDB/MongoLab + Selenium + Google Charts.
Screenshots:
Home Page:
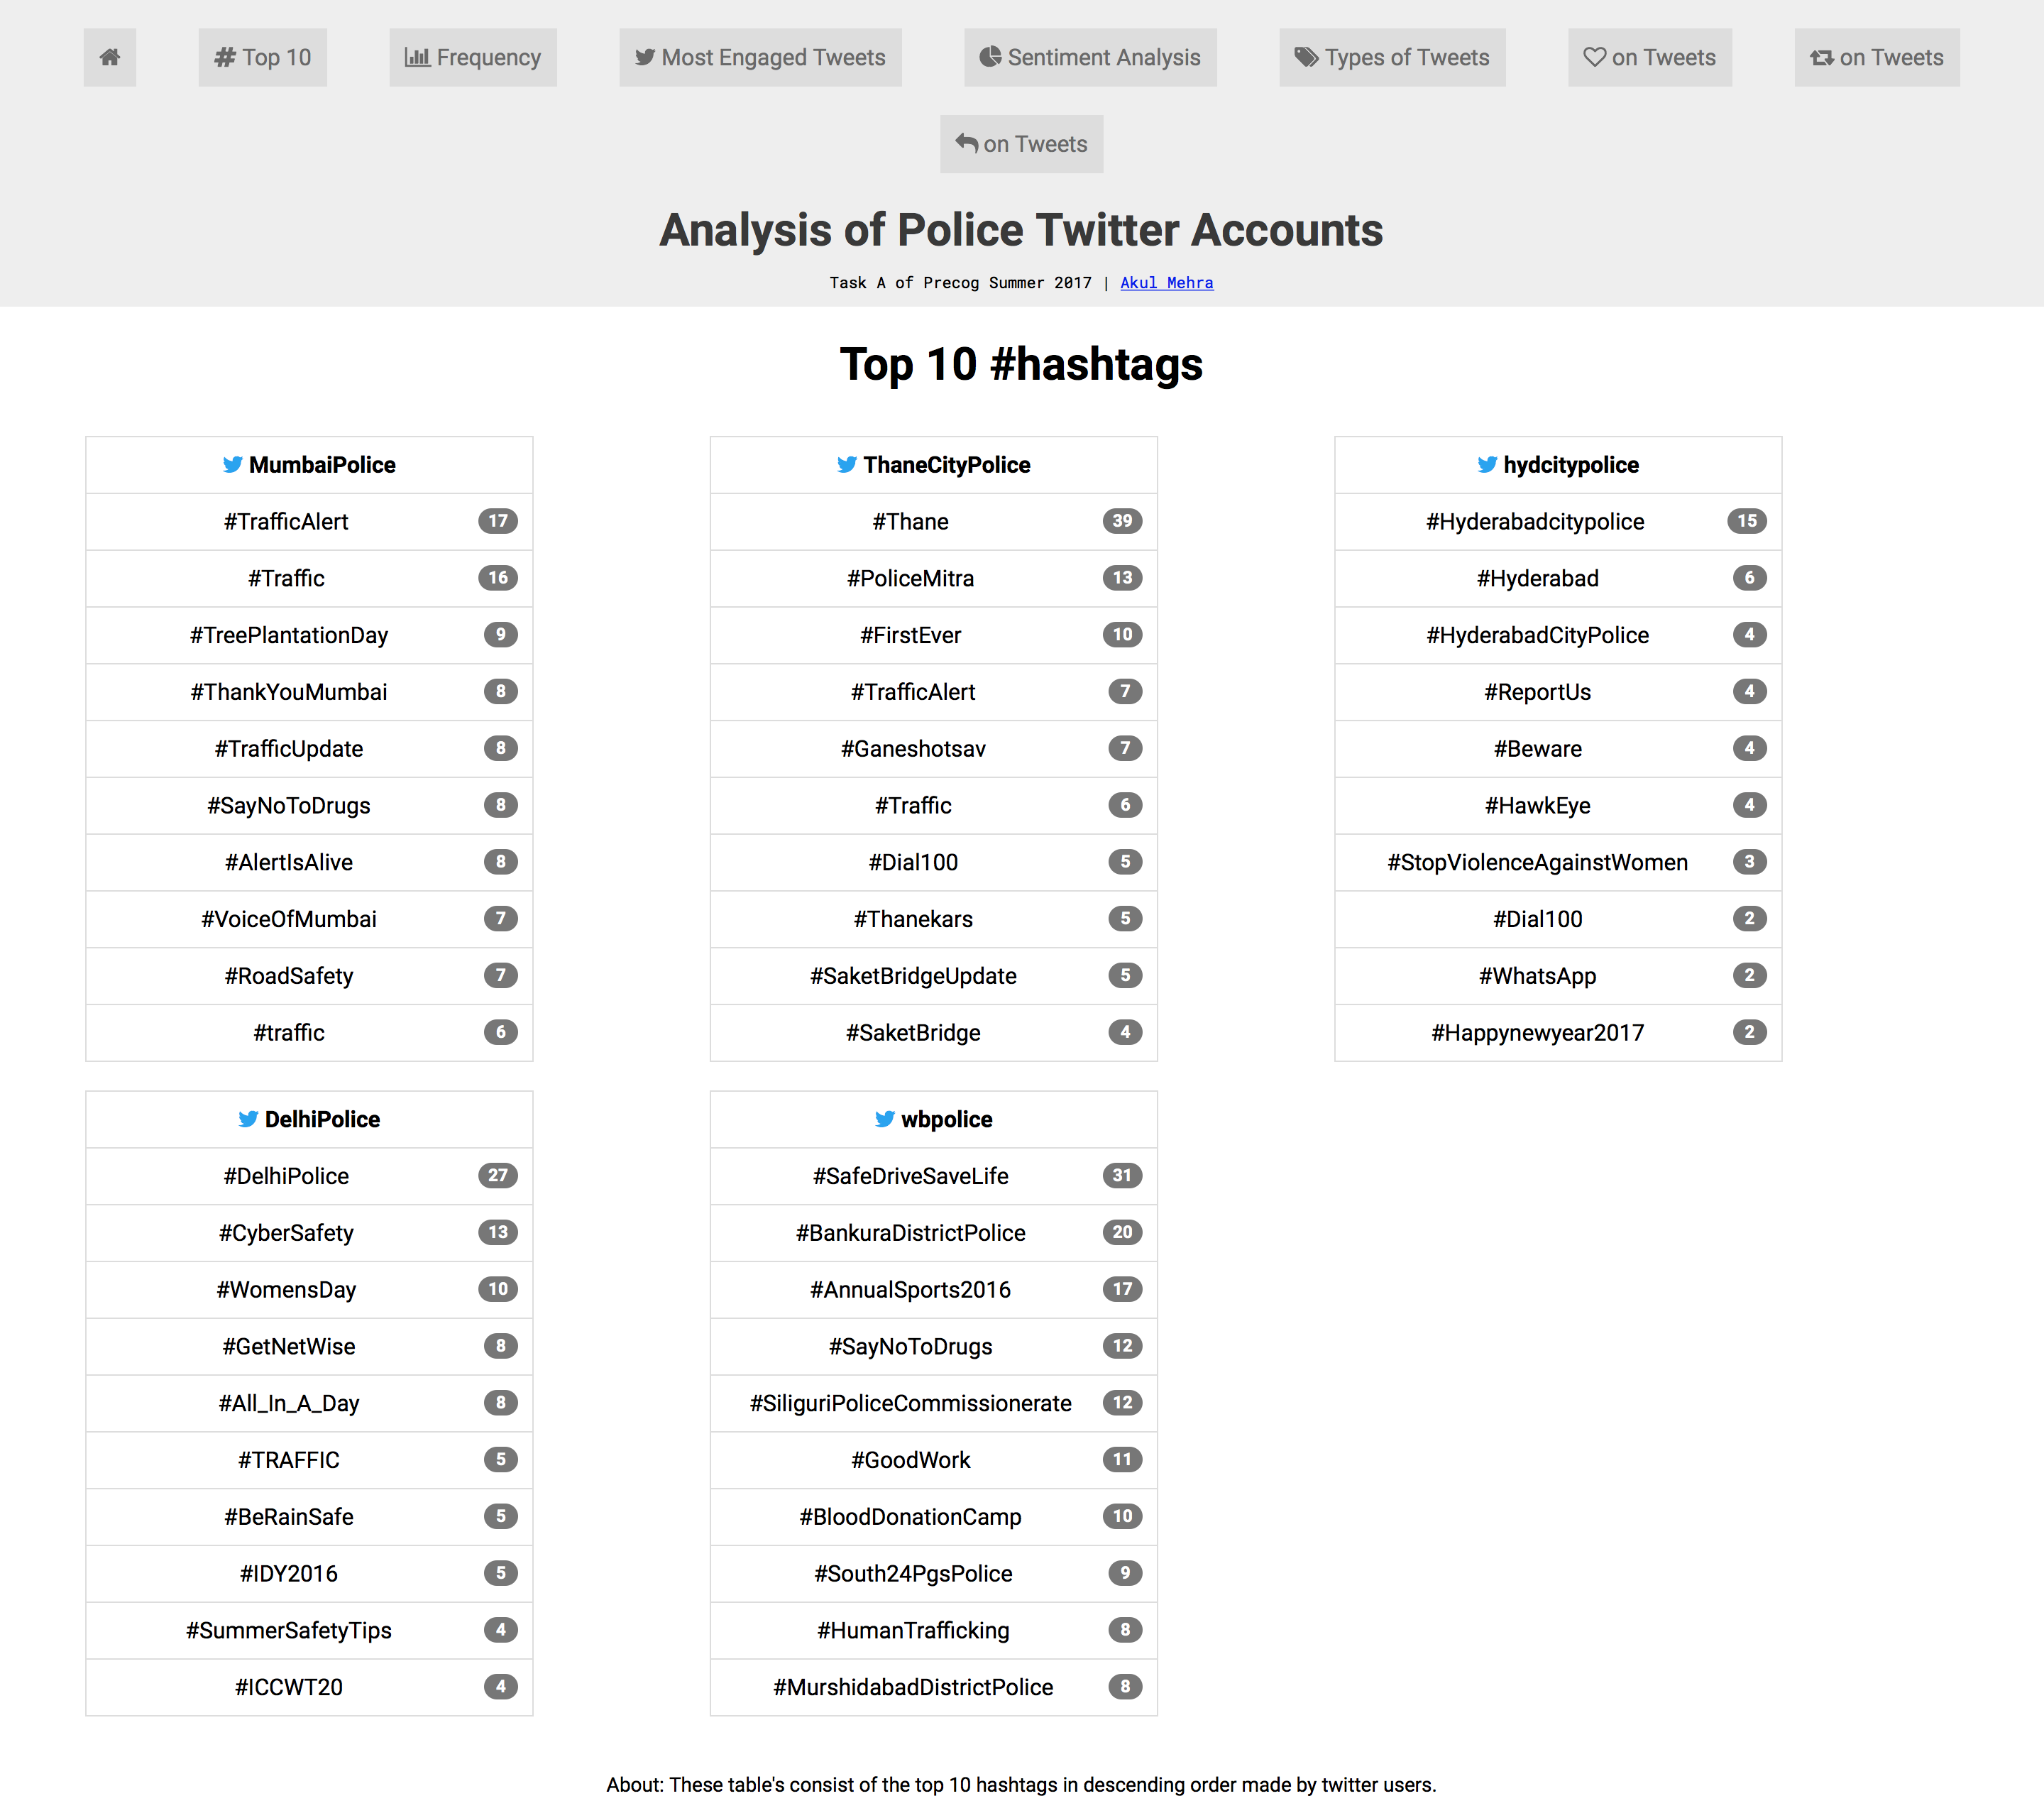
Top 10 Hashtags:
These table’s consist of the top 10 hashtags in descending order made by twitter users.
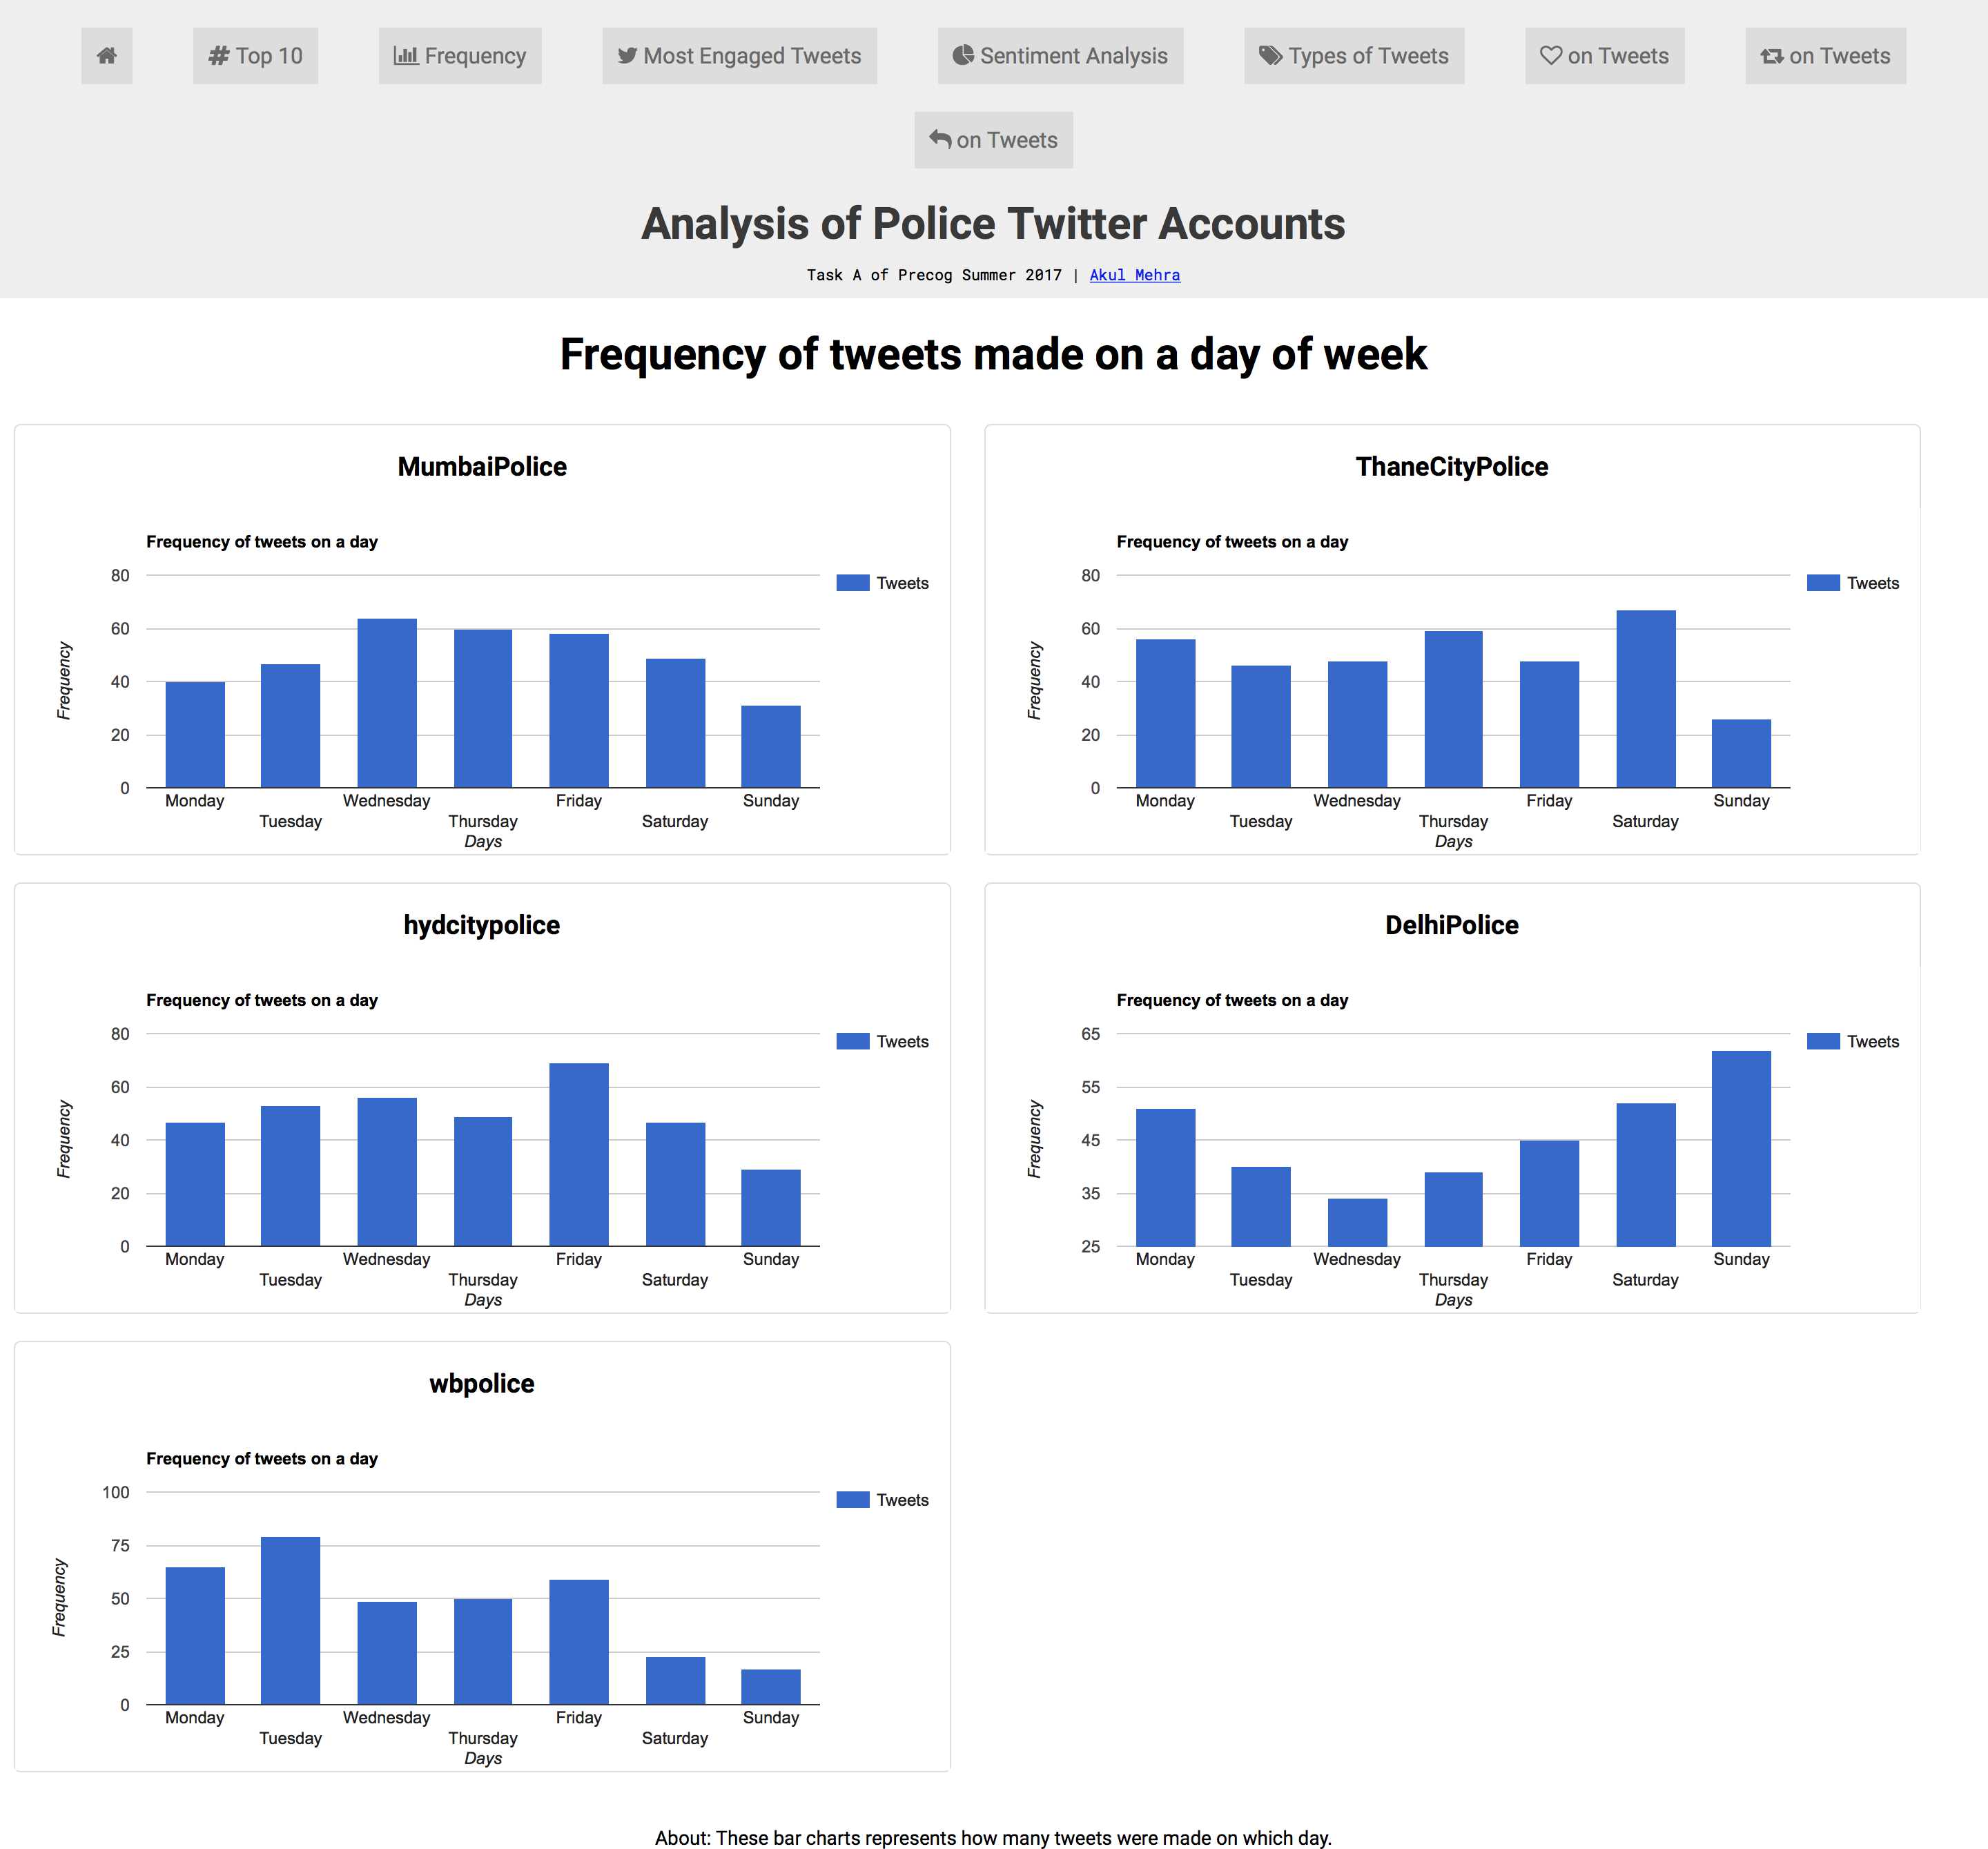
Frequency of Tweets:
These bar charts represents how many tweets were made on which day.
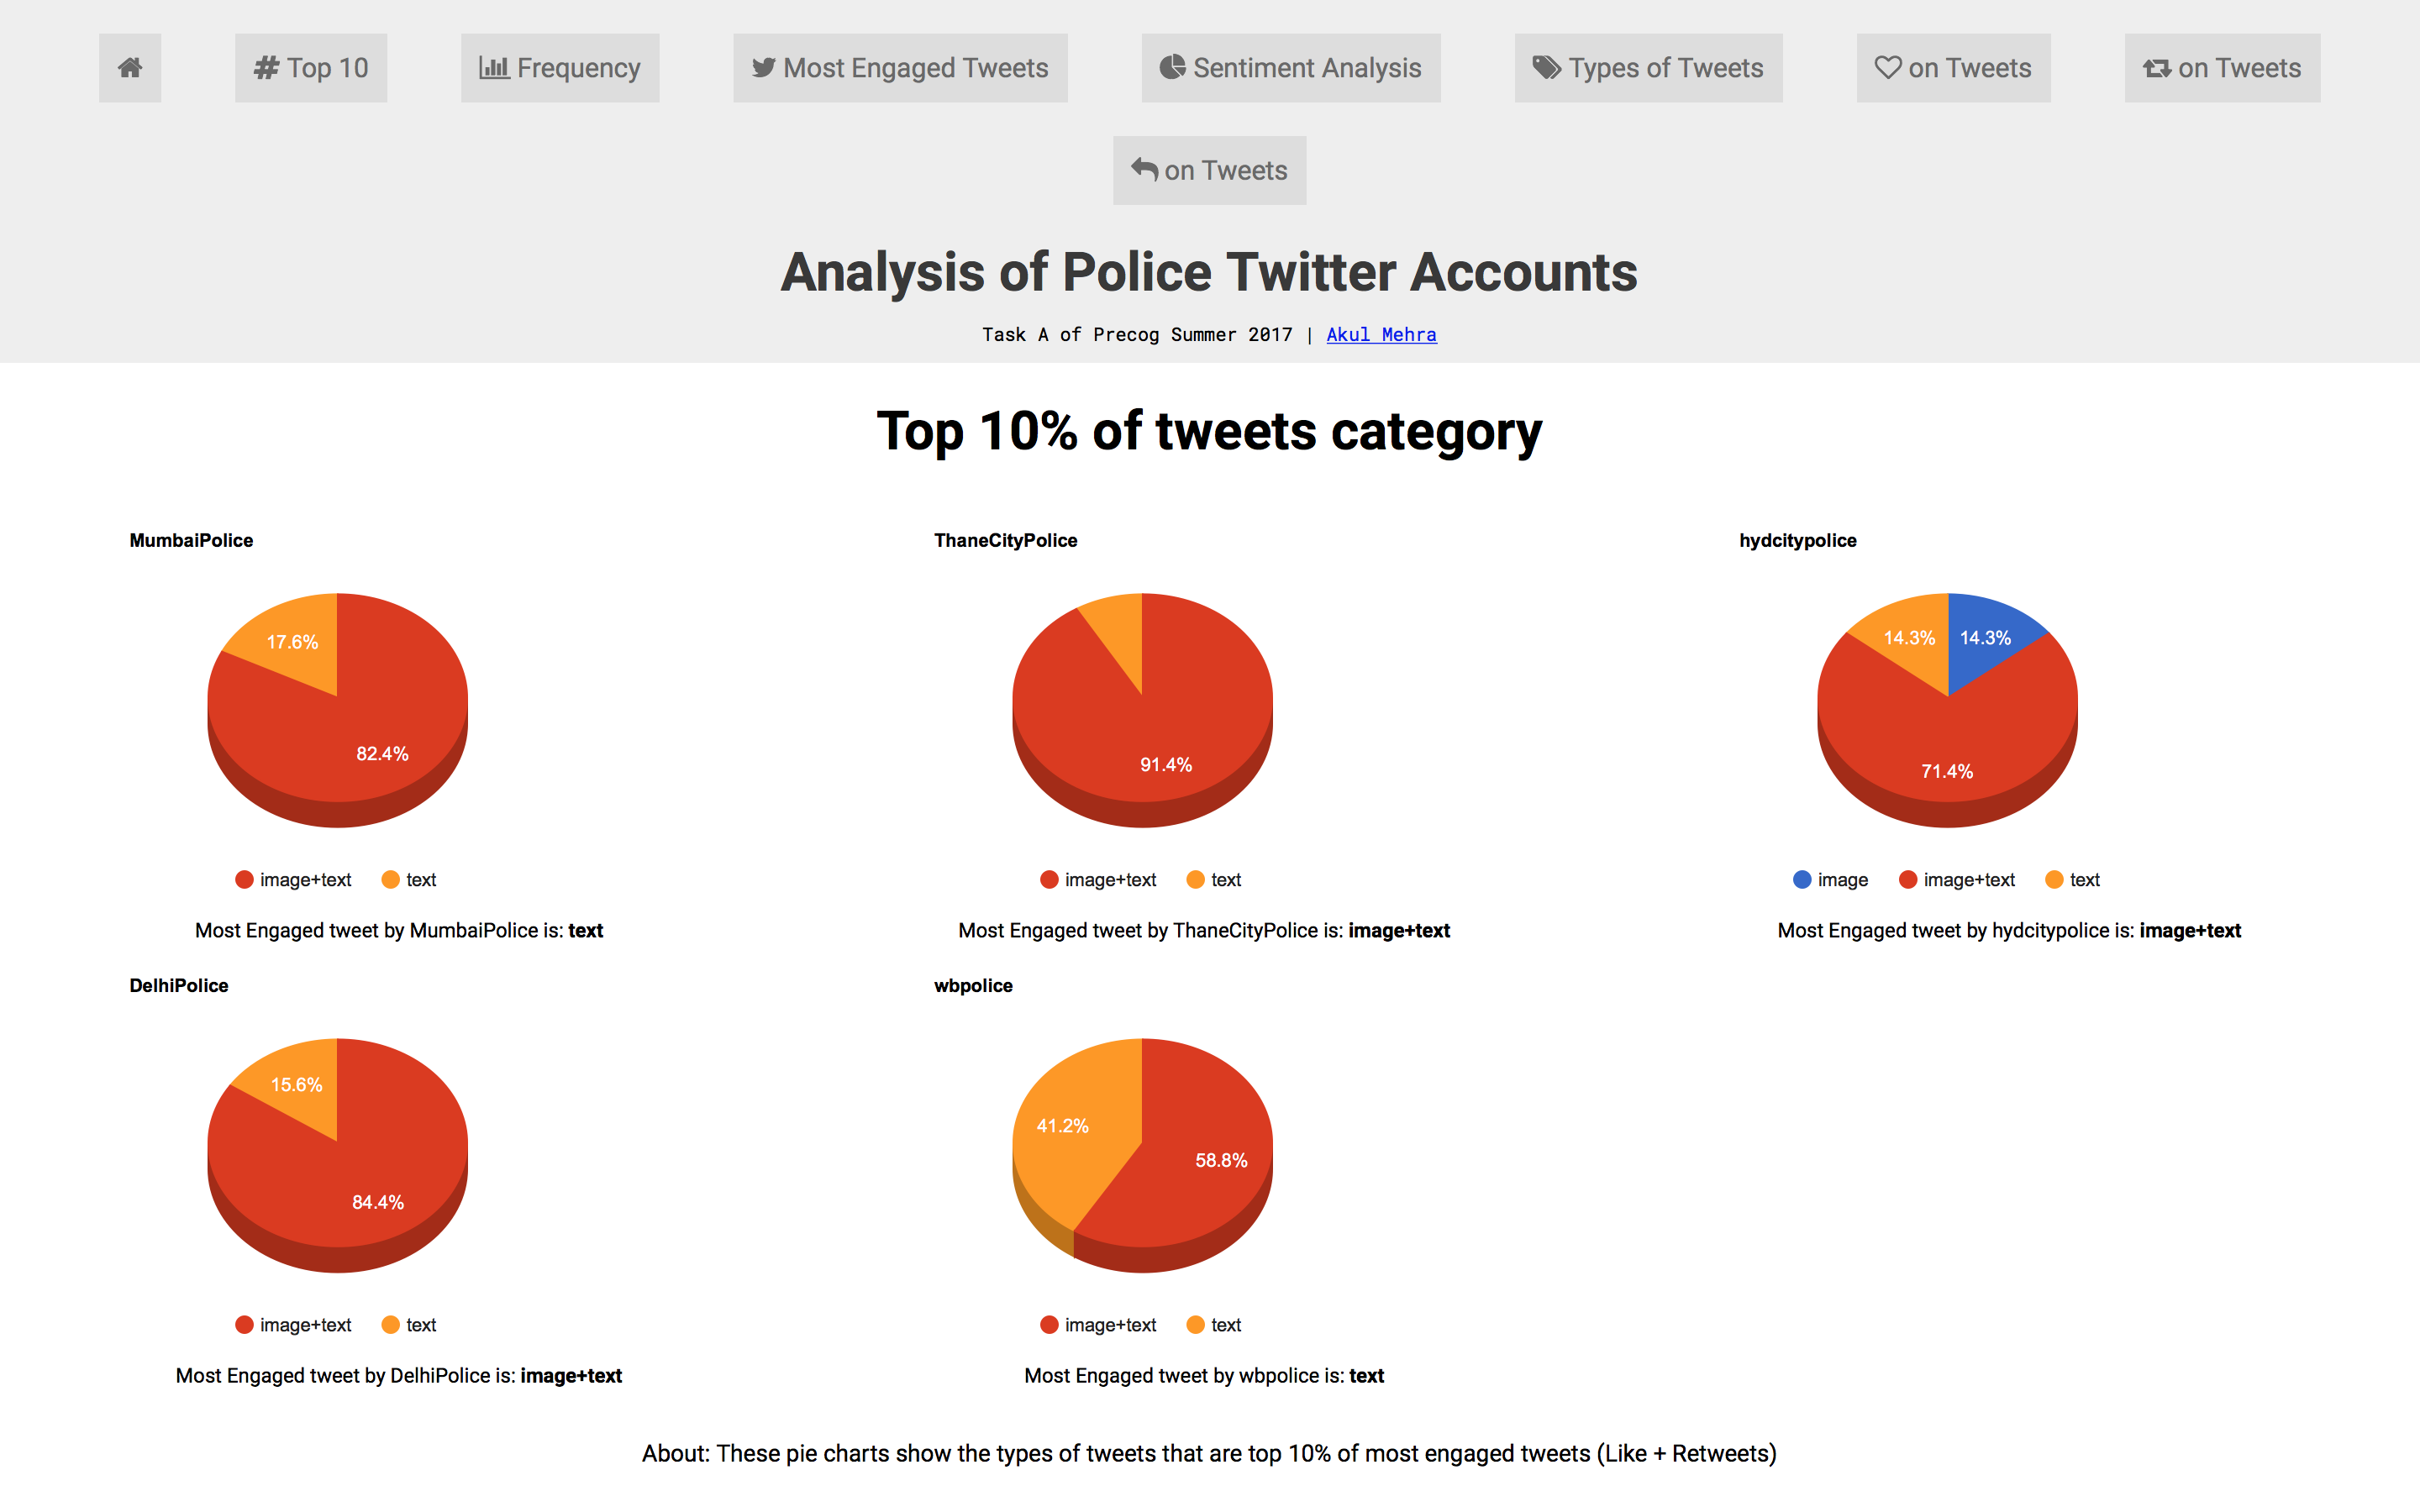
Most Engaged Tweets:
These pie charts show the types of tweets that are top 10% of most engaged tweets (Like + Retweets)
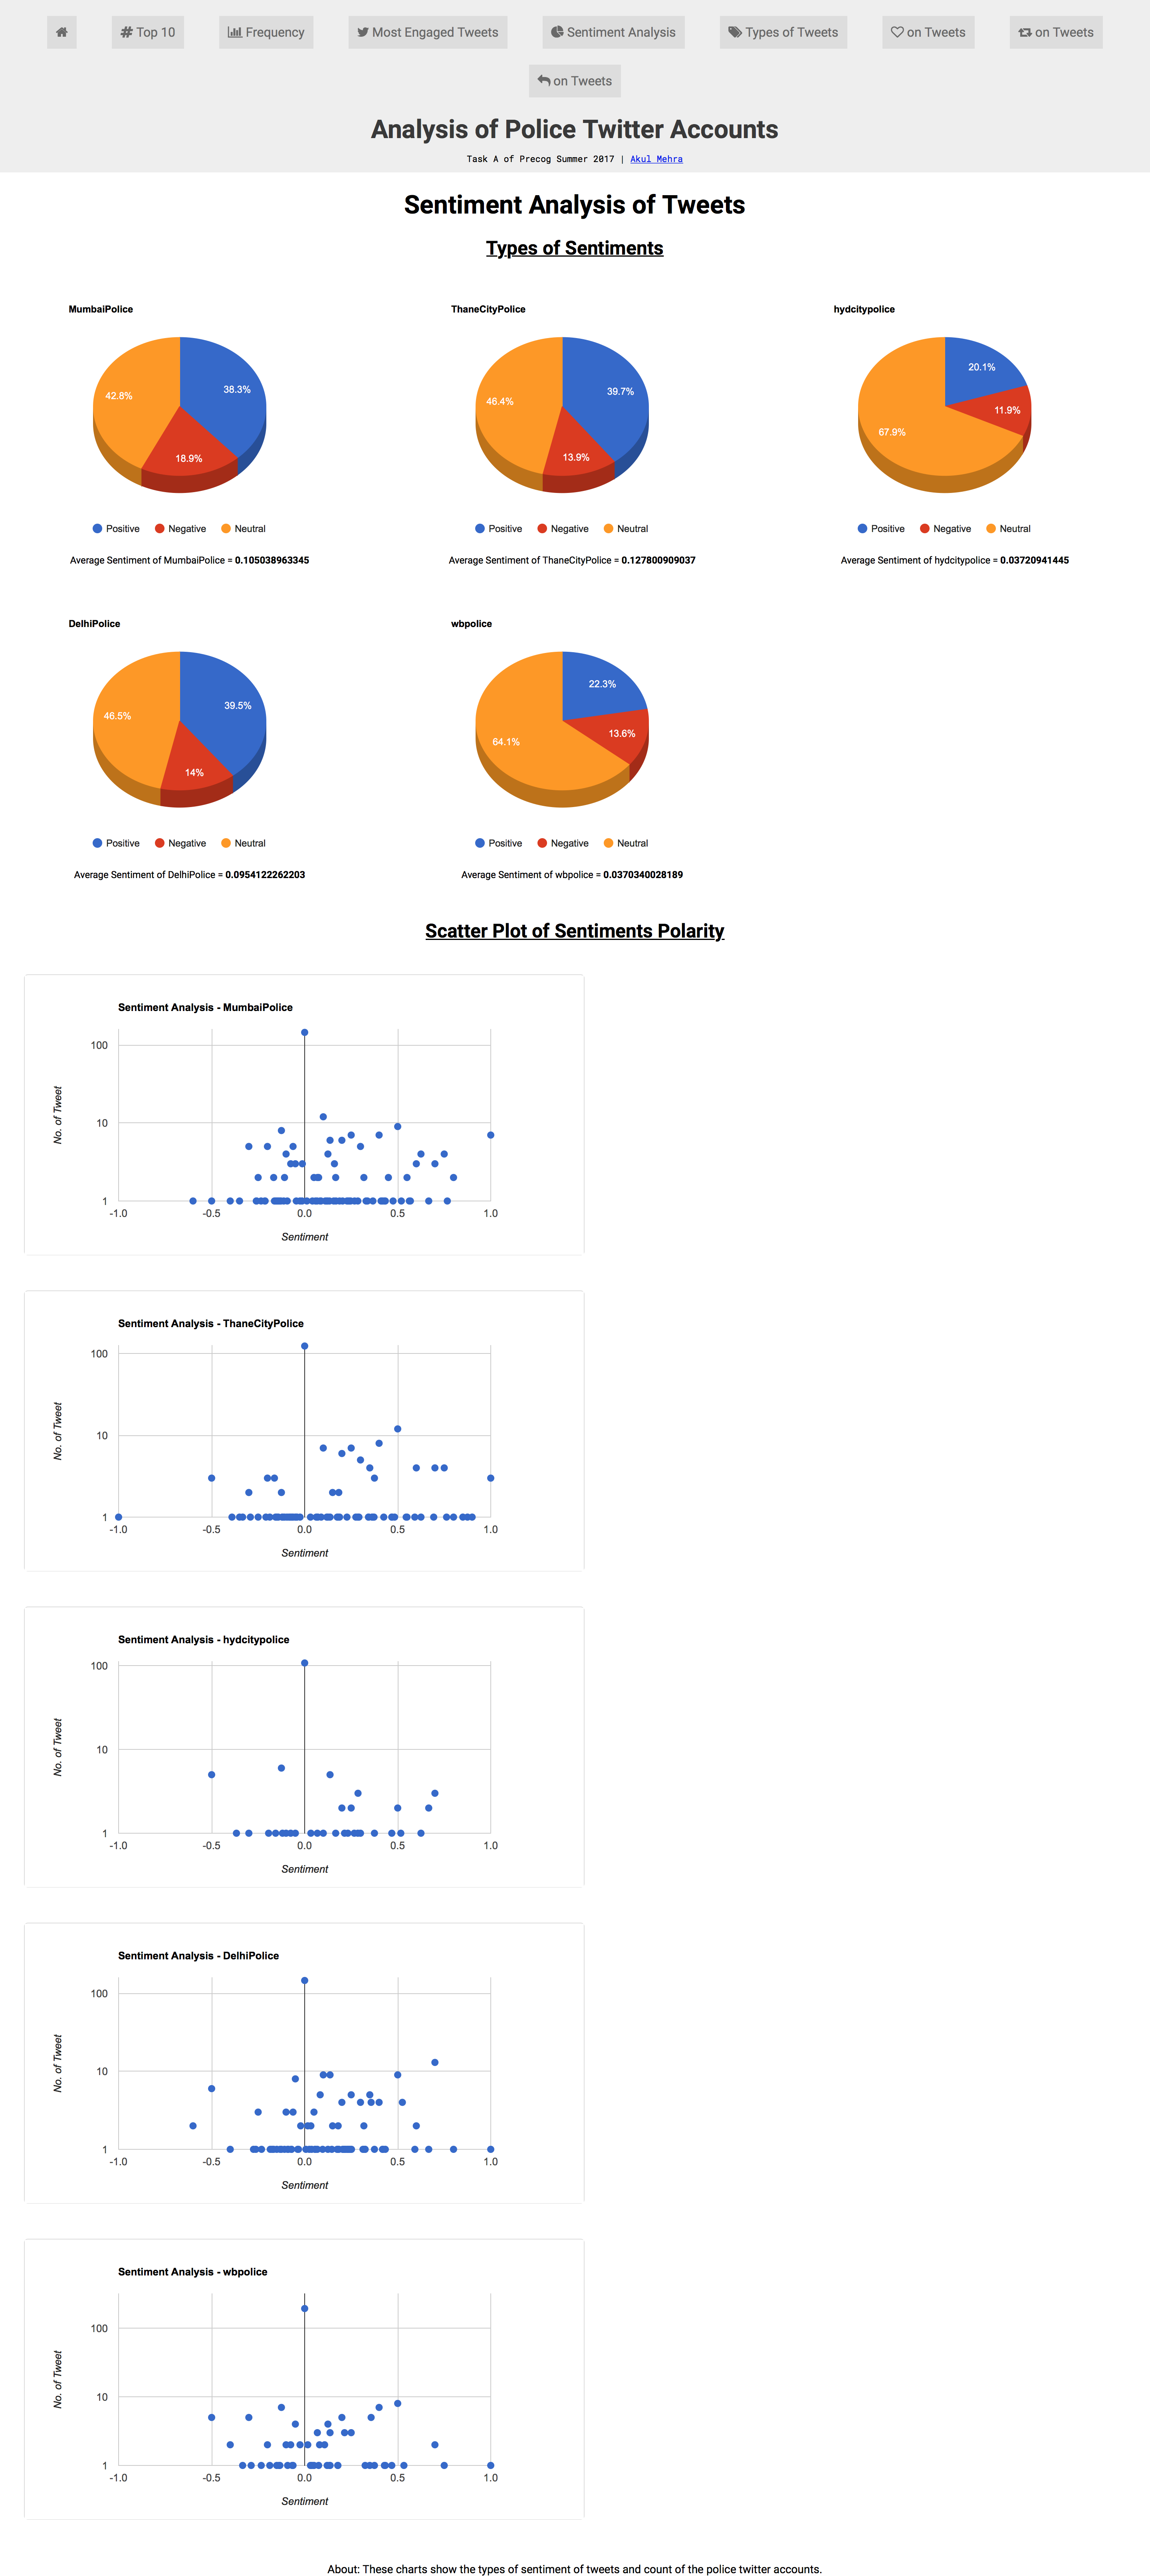
Sentiment Analysis of Tweets:
These charts show the types of sentiment of tweets and count of the police twitter accounts.
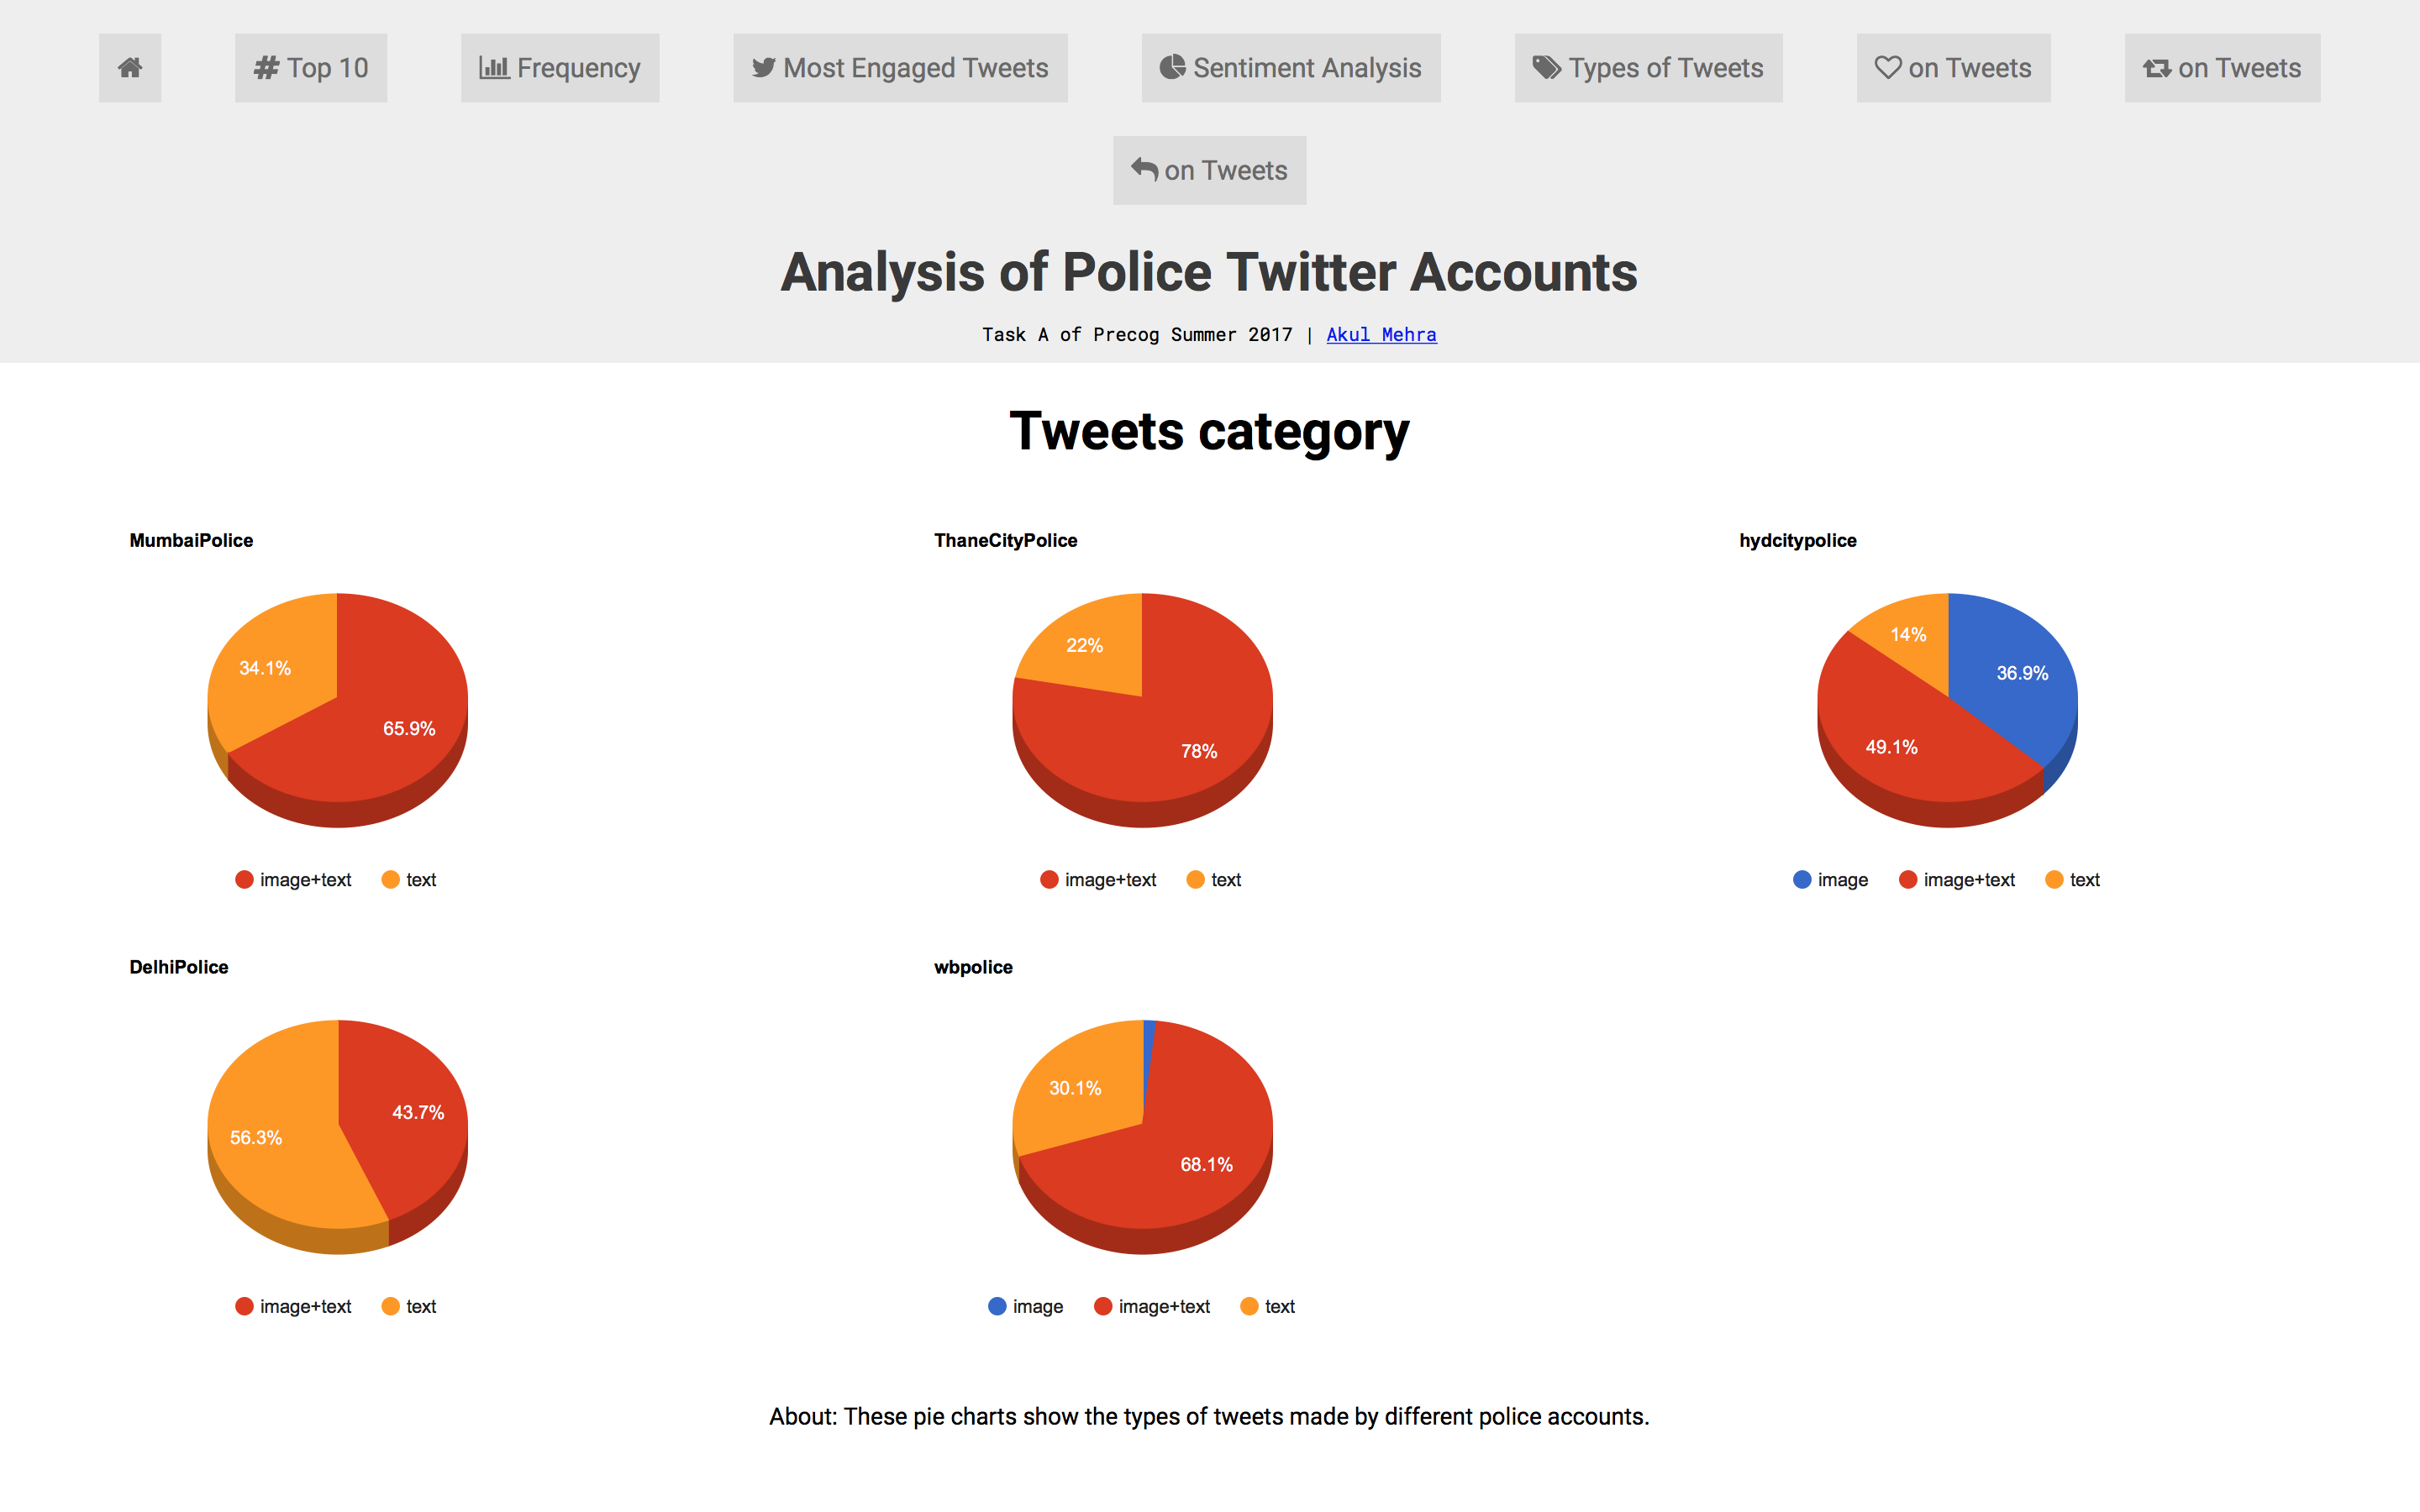
Types of Tweets:
These pie charts show the types of tweets made by different police accounts.
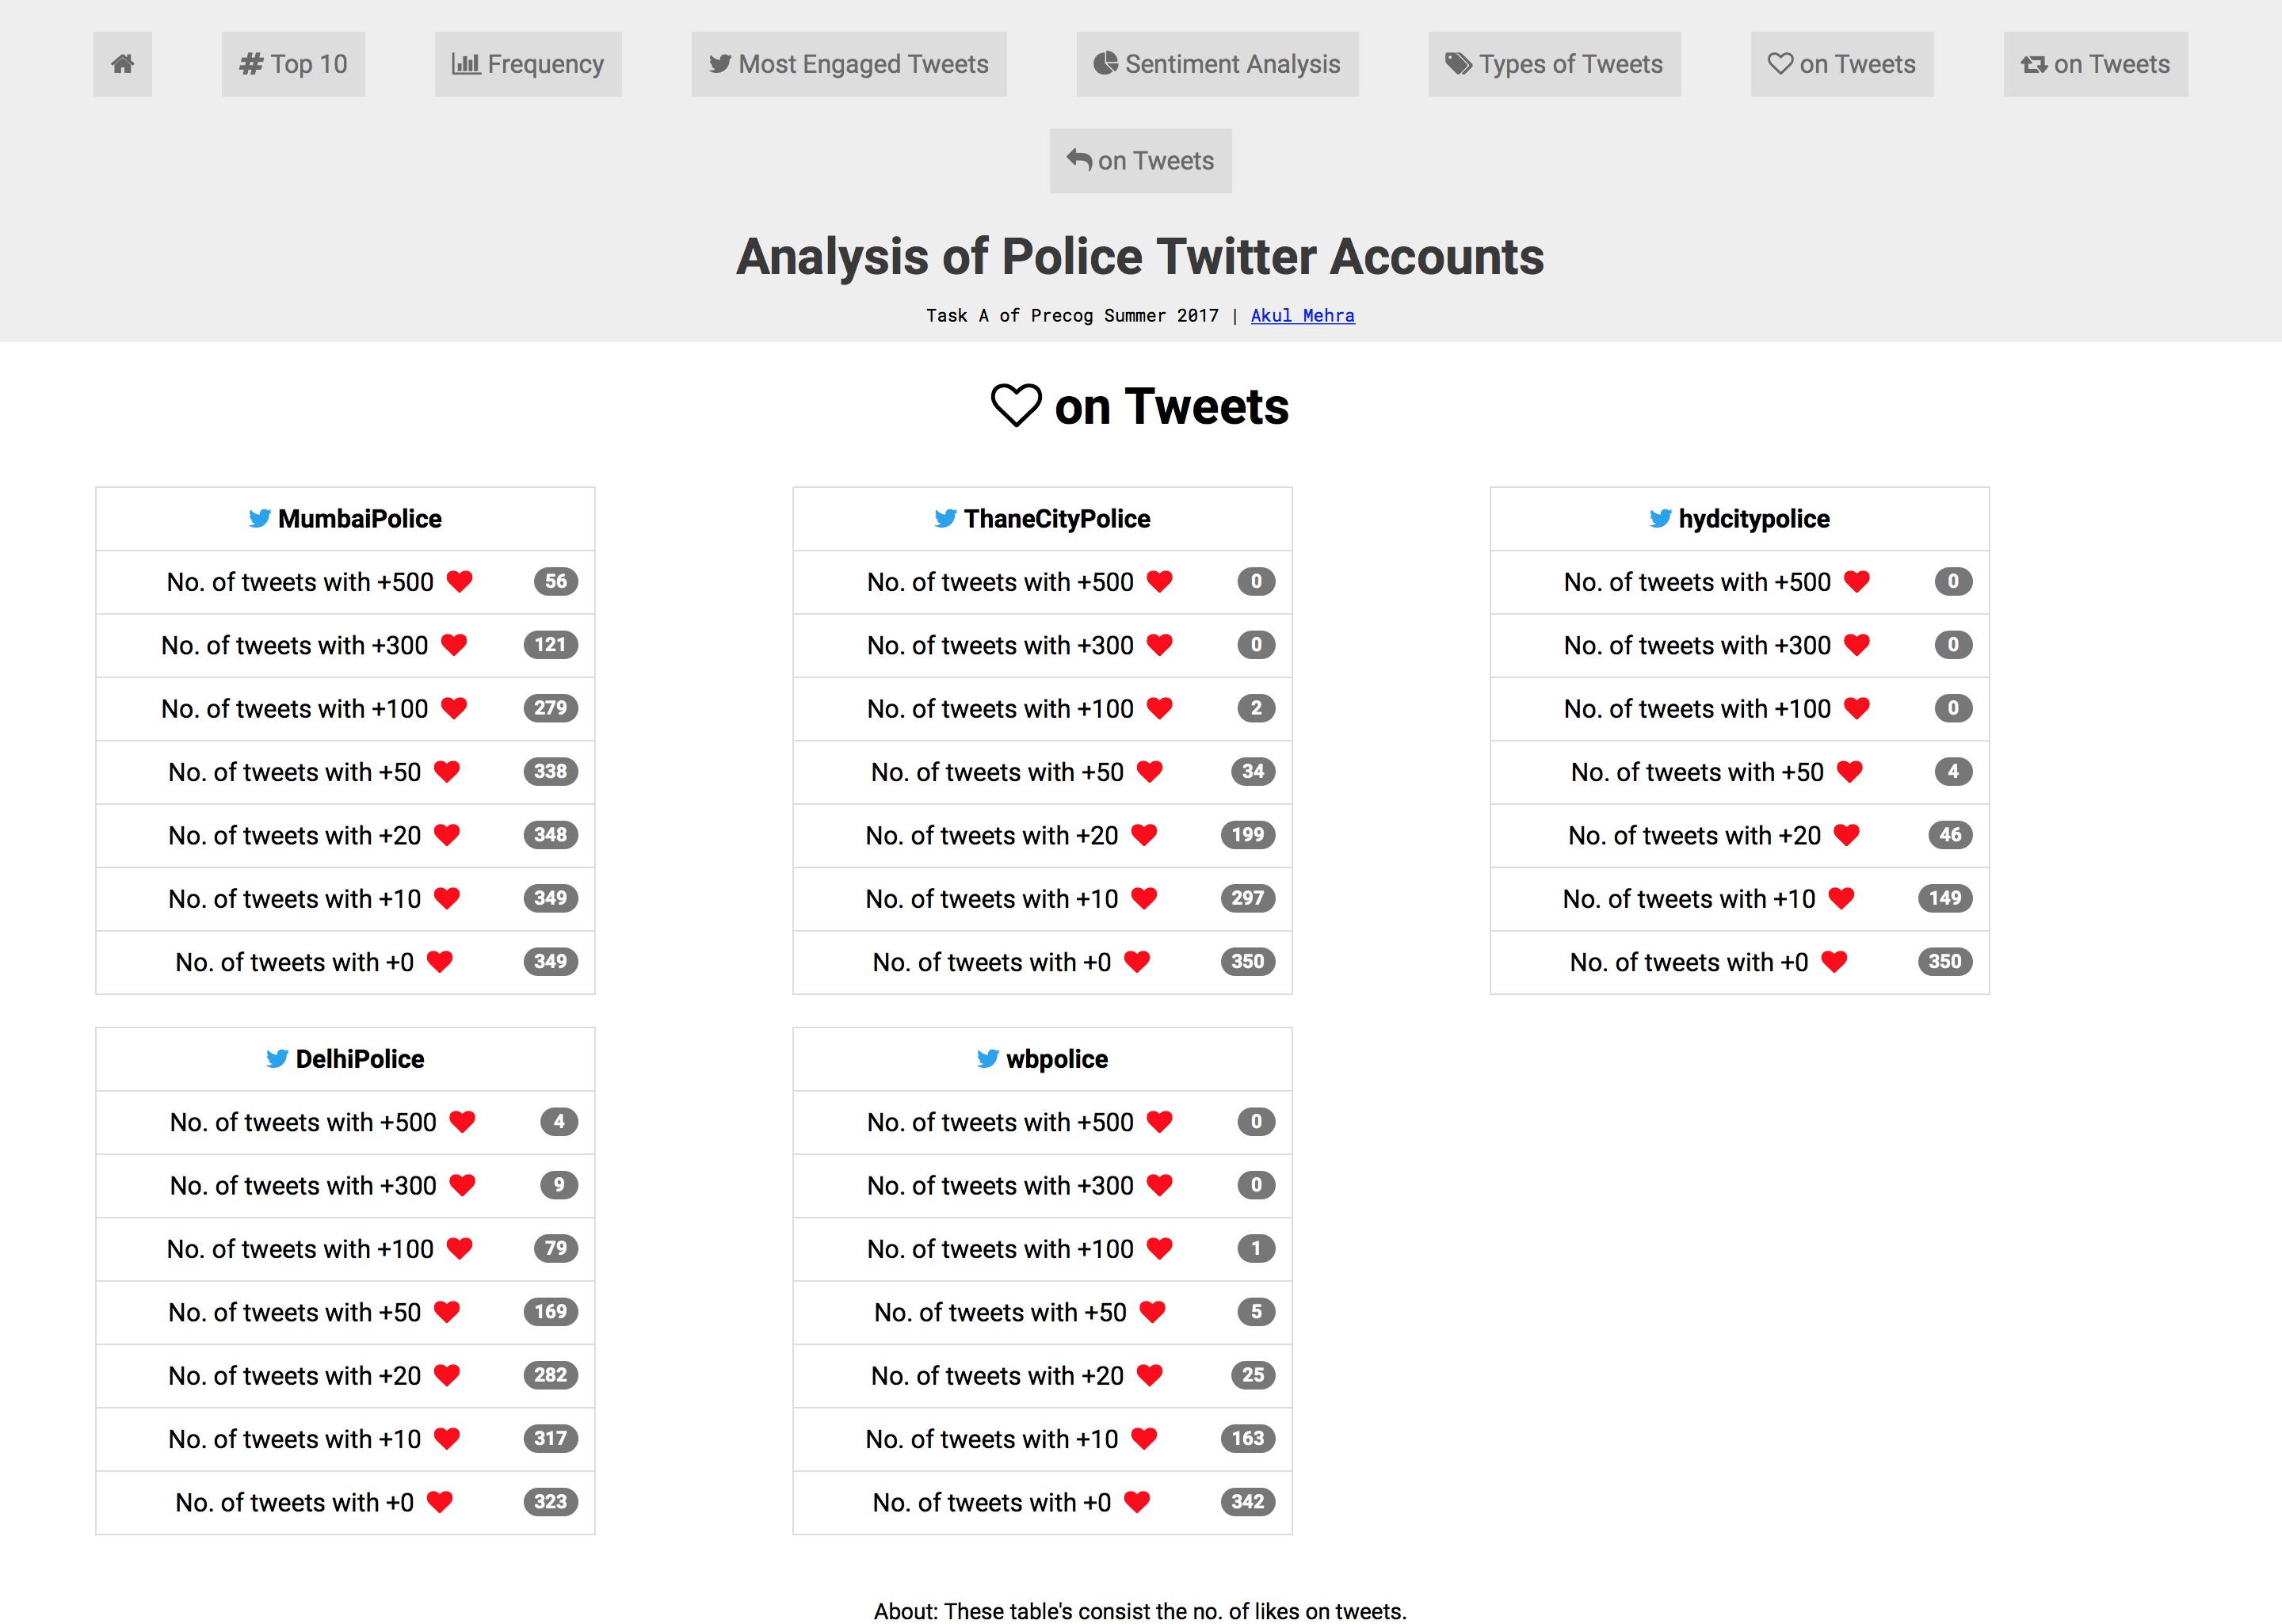
Likes on Tweets:
These table’s consist the no. of likes on tweets.
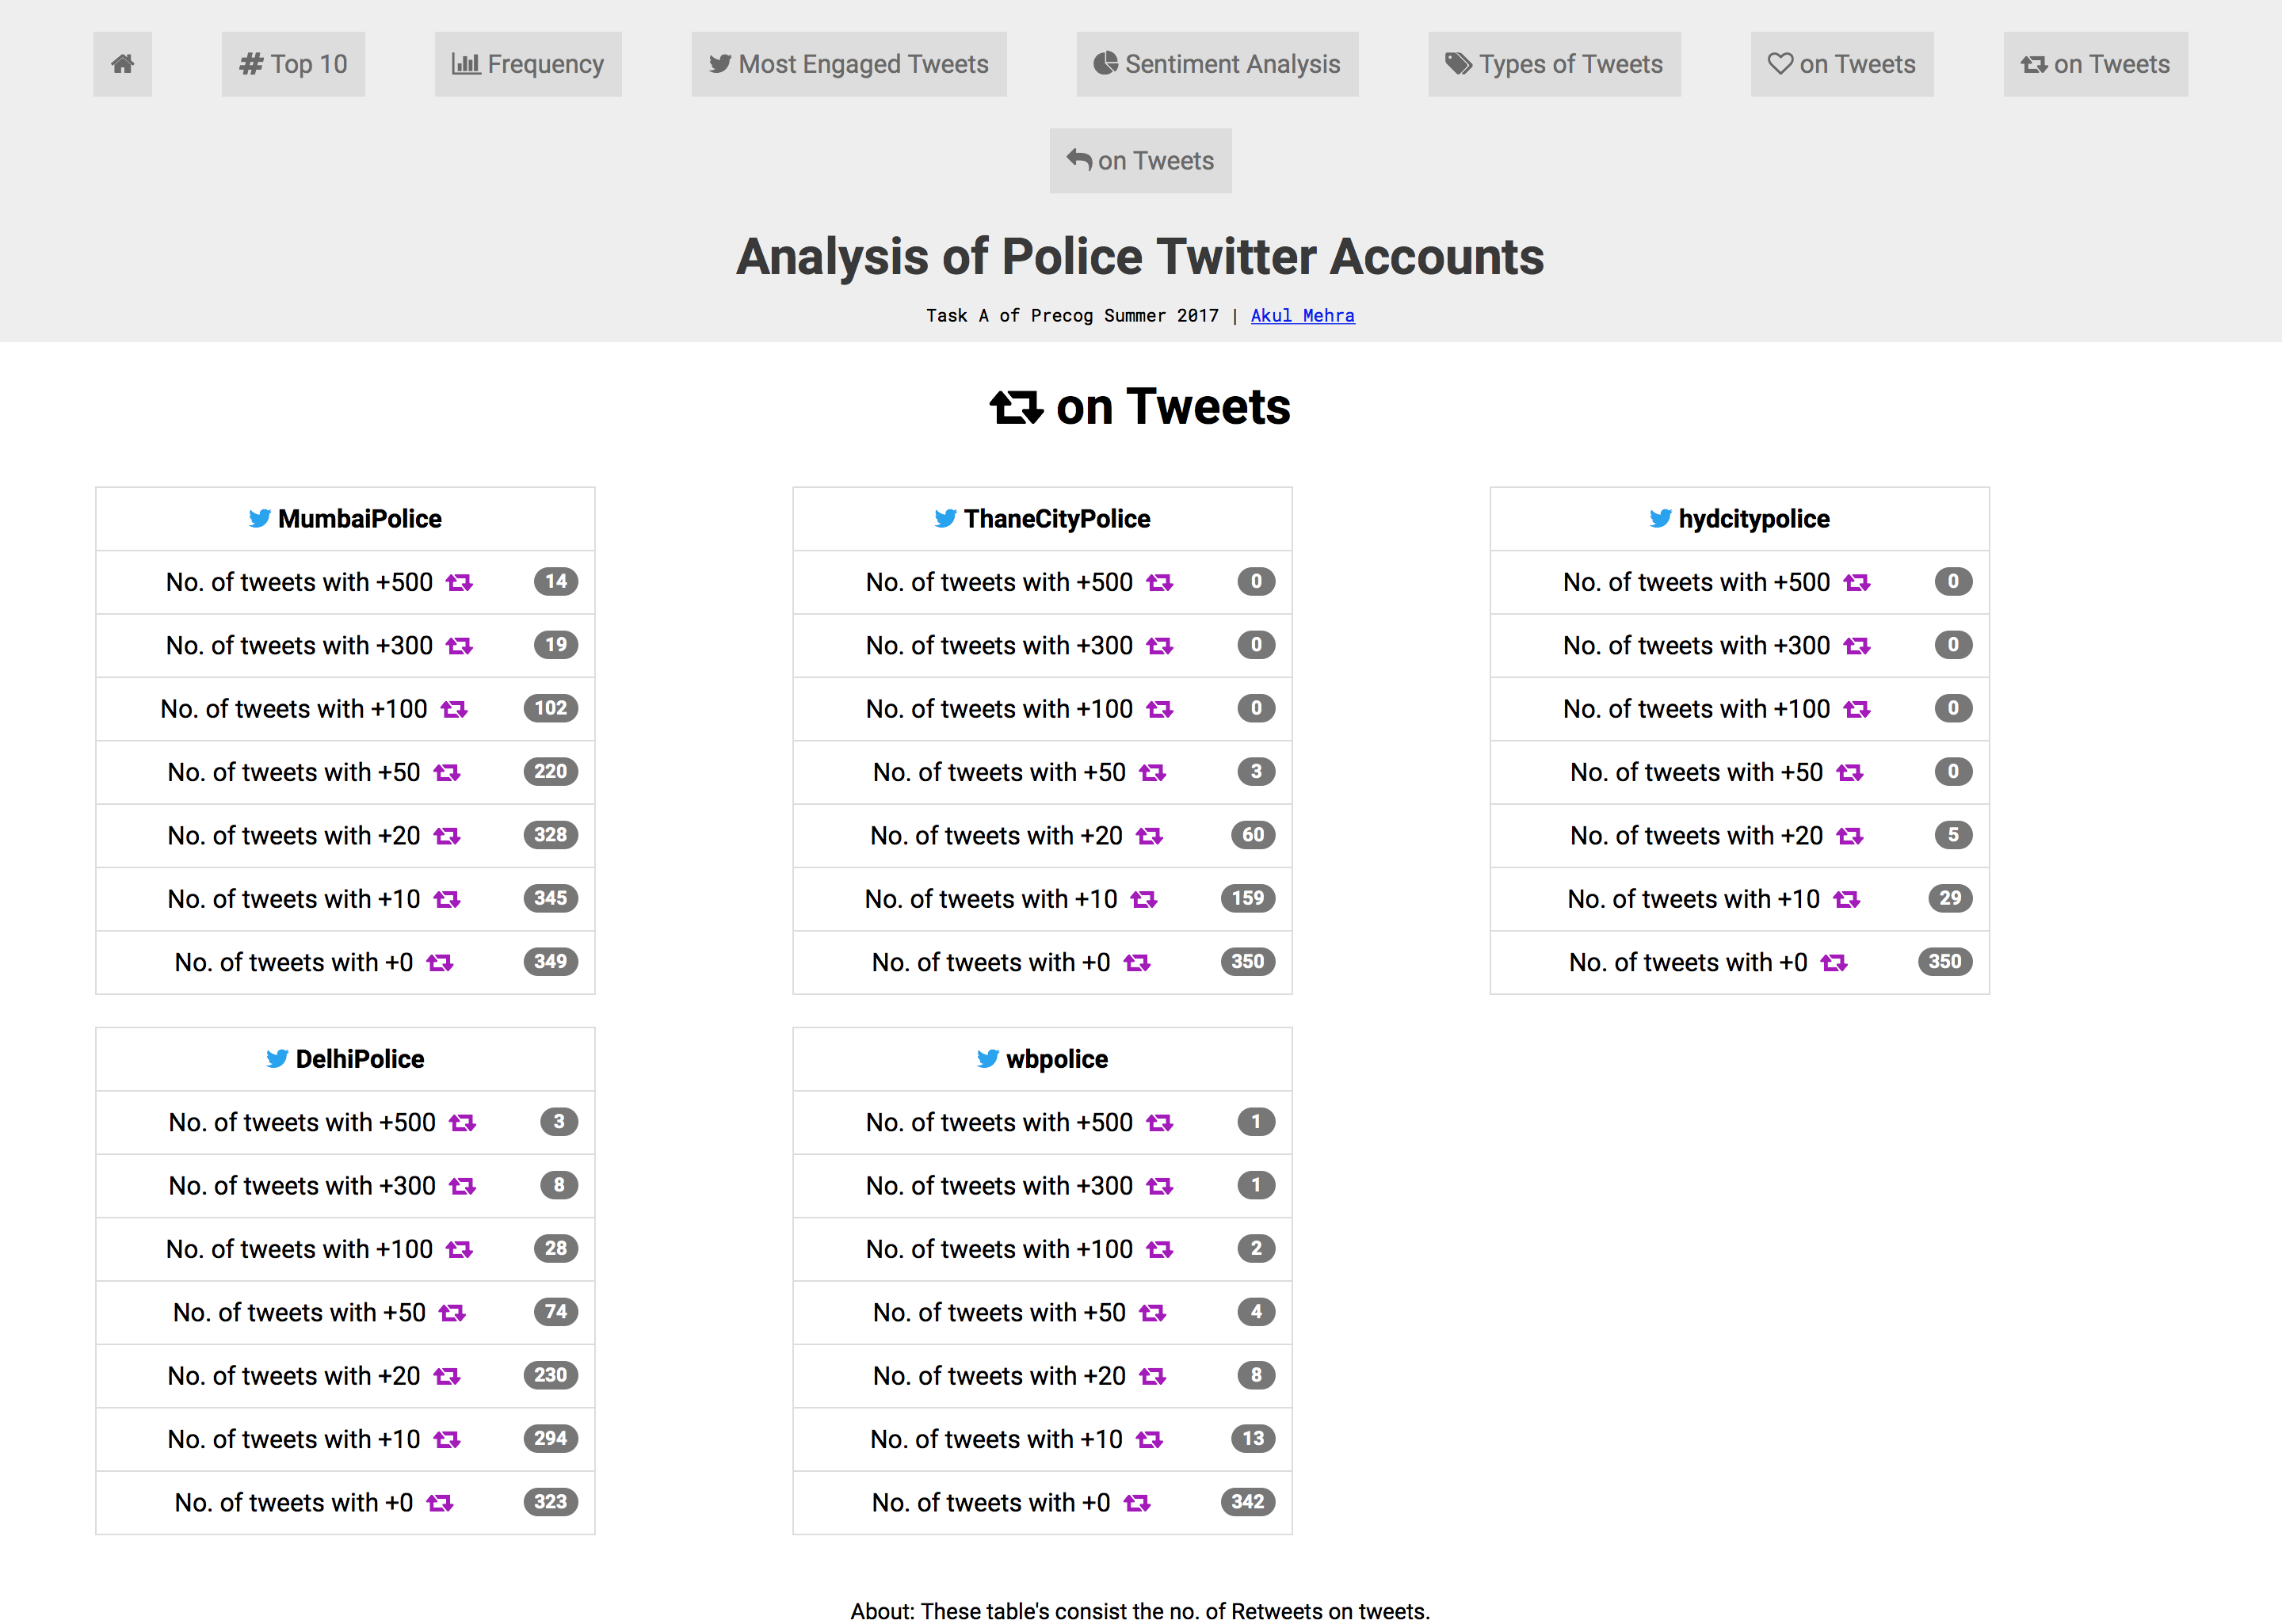
Retweets on Tweets:
These table’s consist the no. of Retweets on tweets.
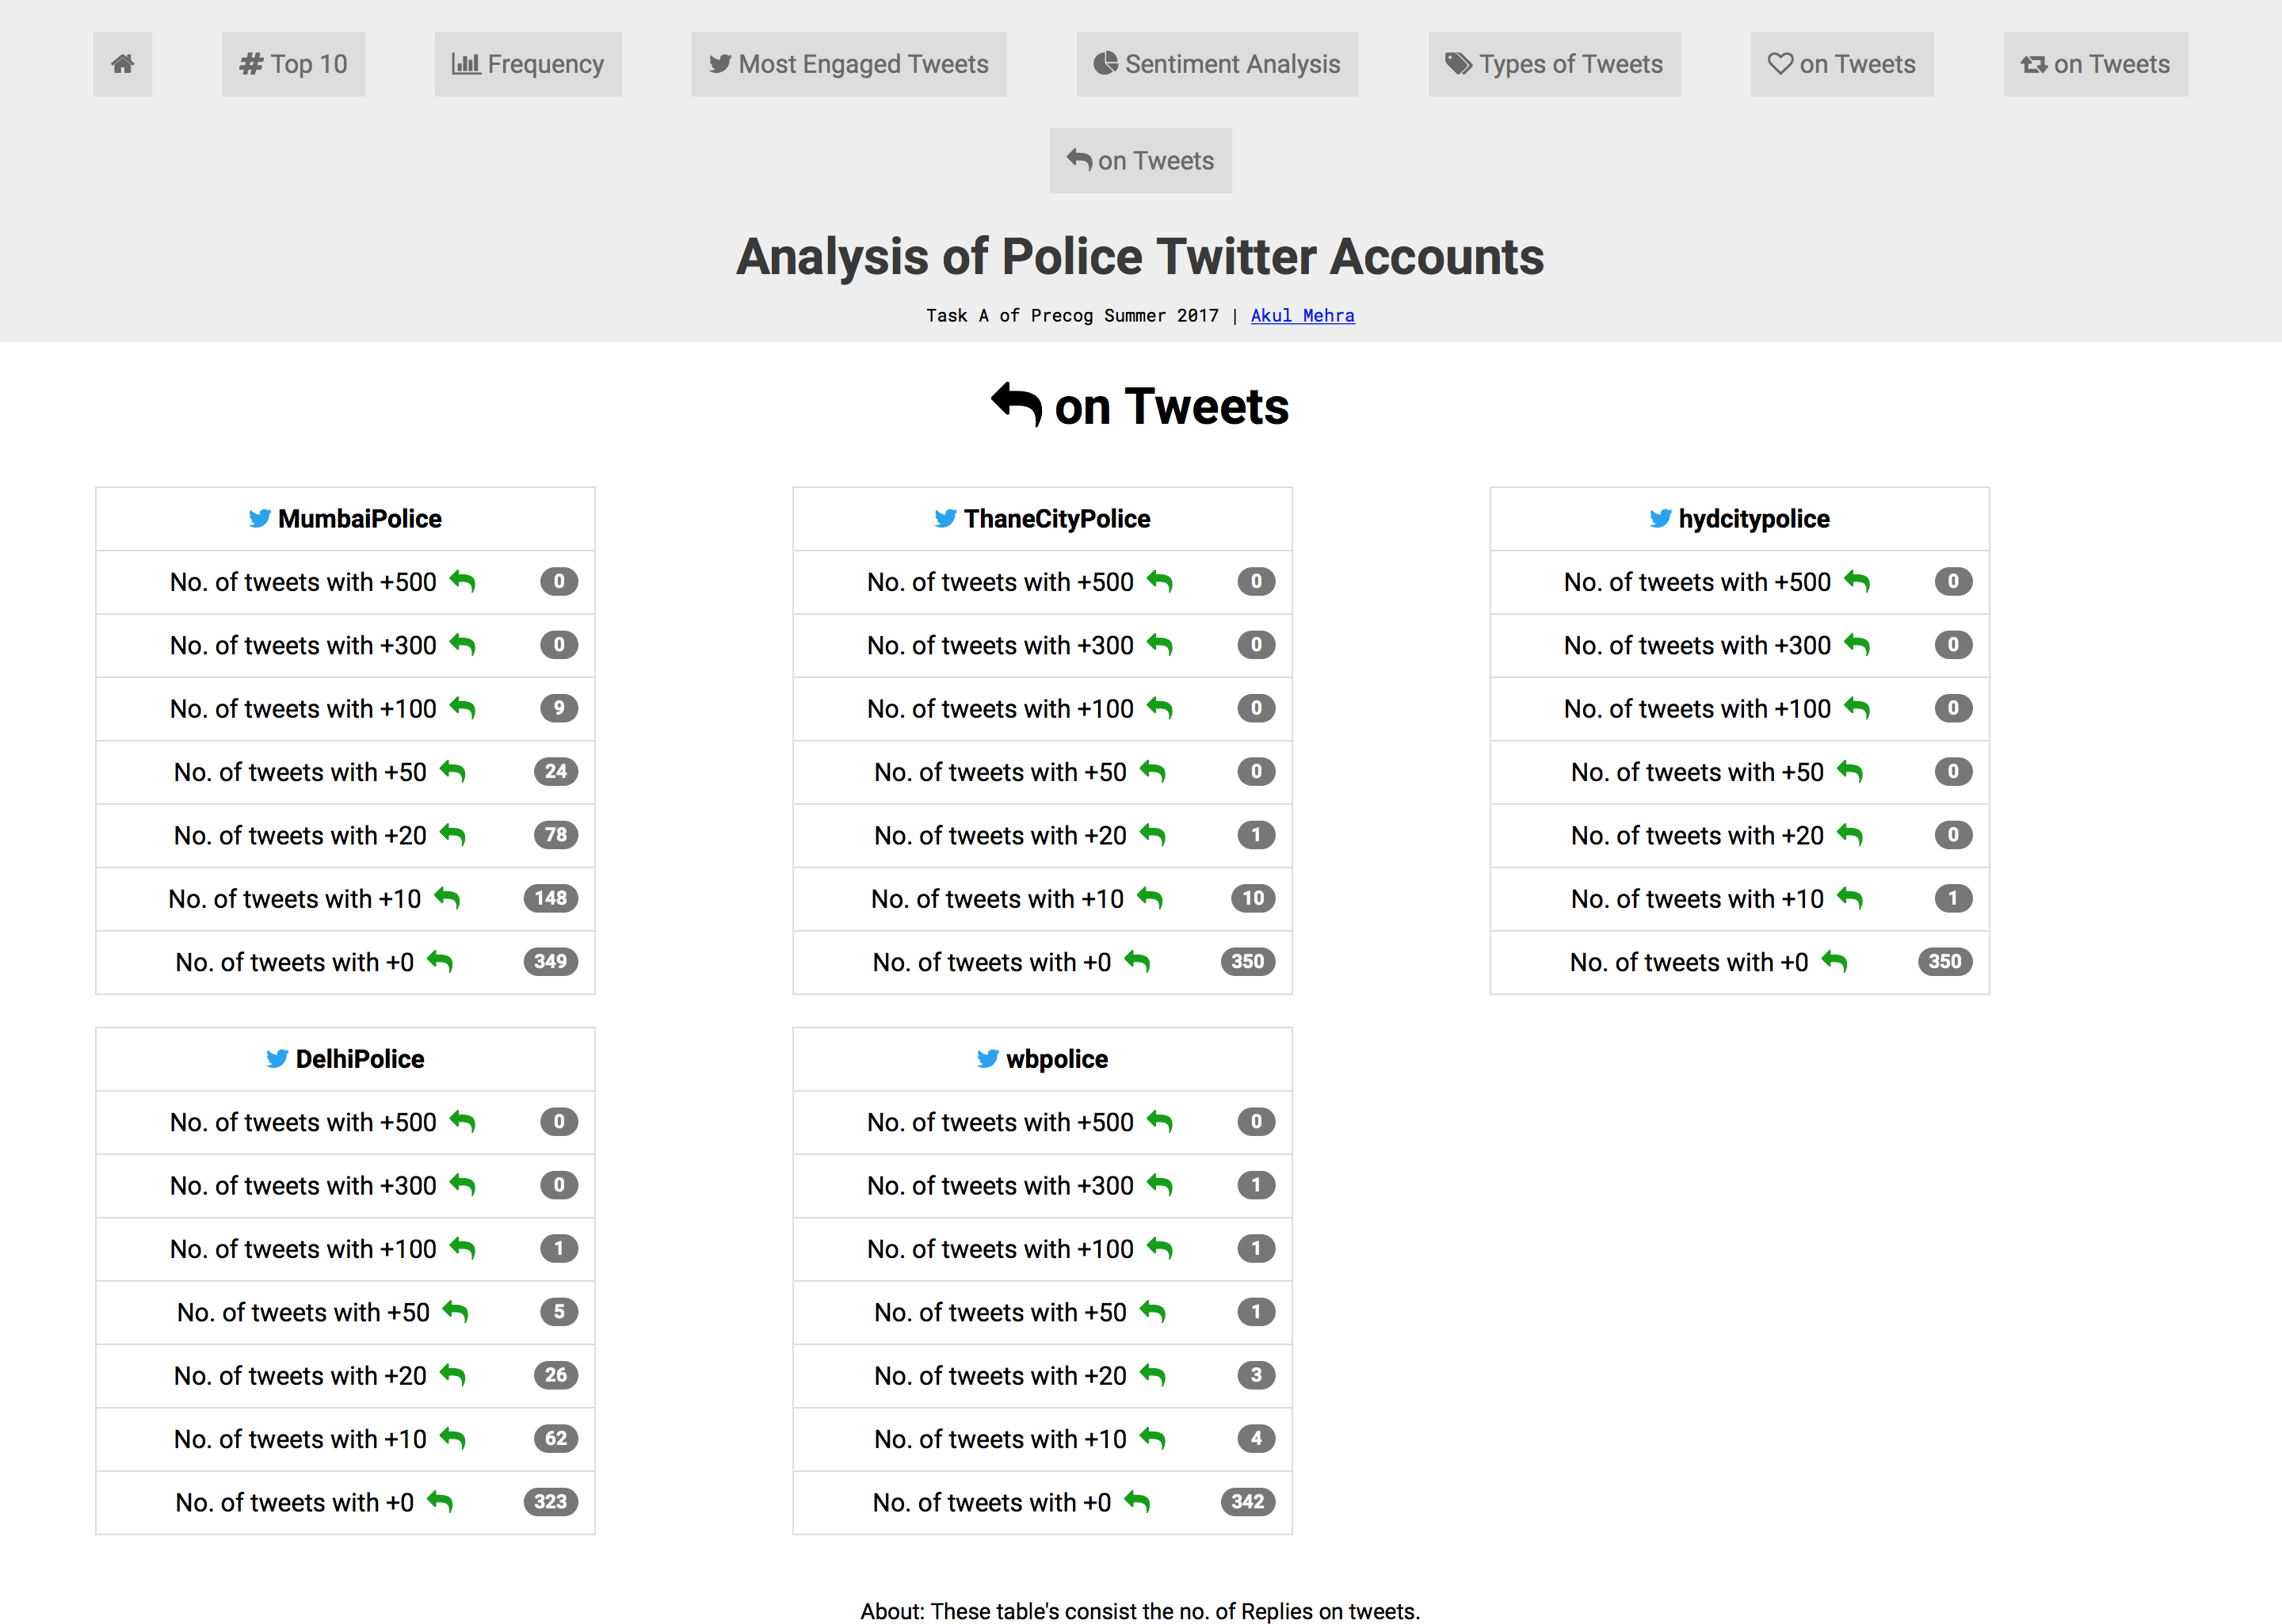
Replies on Tweets:
These table’s consist the no. of Replies on tweets.
Link to Web App: Here
Link to Github Repo: Here